


How to Use Support and Resistance in Forex Like a Pro
- Ankit Gupta
- September 8, 2025

Introduction:
When you first start trading Forex, you’ll hear people talk about “support” and “resistance” almost everywhere. It can sound complicated, but the truth is, these are just points on a chart where price tends to stop, pause, or bounce. Once you understand how they work, they become one of the most reliable tools in your trading. In this blog, we’ll break down what support and resistance levels are, the different types you’ll see, and how you can actually use them in real trades without overthinking.
What is a Support and Resistance Level?
Support Level:
Support is like a floor where the price stops falling. Imagine you drop a ball on the ground – it bounces back. Support works the same way. When price comes down to a certain point and can’t seem to go lower, that’s your support level. It’s where buying interest comes back in.
Resistance Level:
Resistance is the opposite – it’s like a ceiling. When the price keeps going up but struggles to break past a certain point, that’s resistance. Sellers step in, and the price often bounces back down.
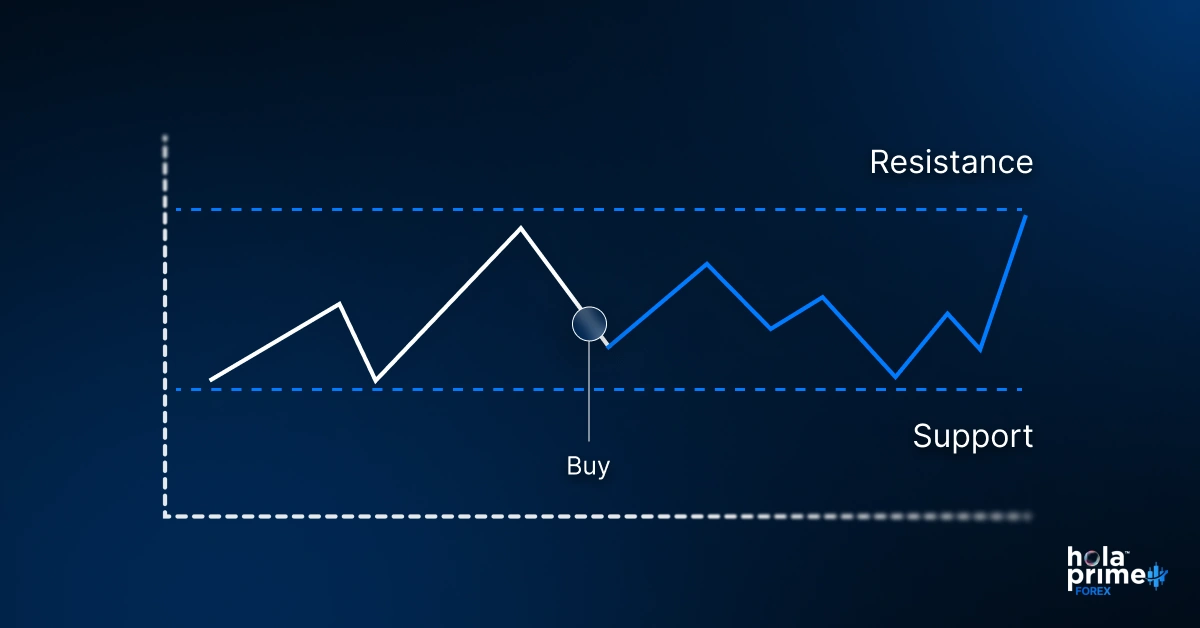
Support and resistance are basically flip sides of the same coin, and once you spot them, you’ll realize they repeat over and over again.
Major Types of Support and Resistance
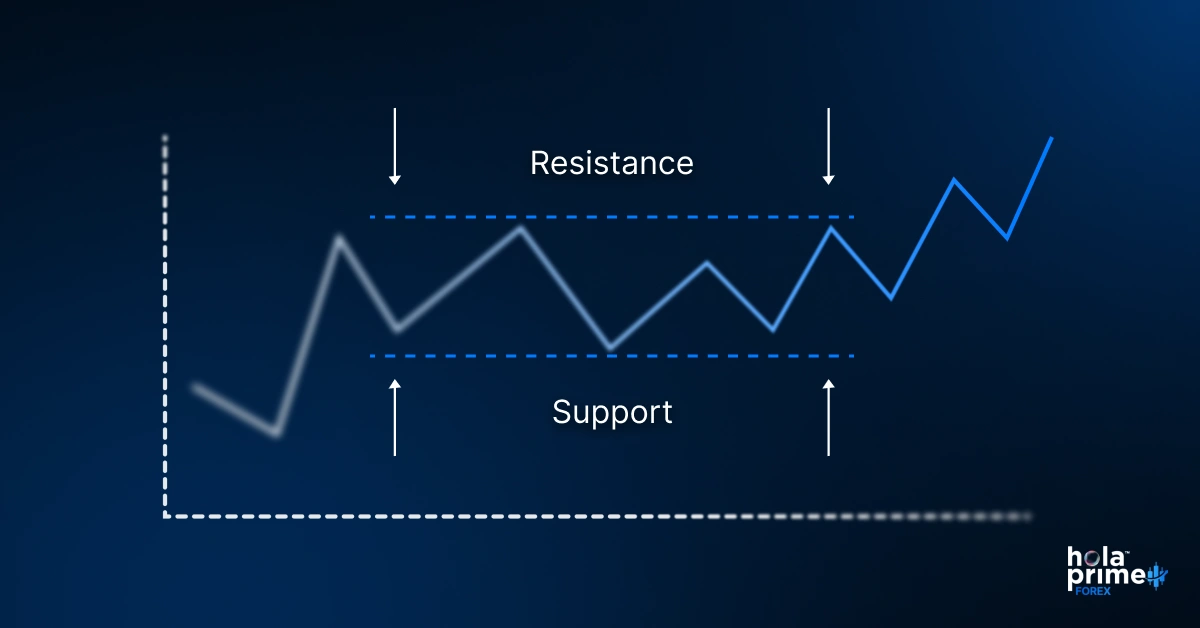
1. Static support and resistance levels
These are the easiest to spot. They’re simple horizontal lines drawn where the price has reacted multiple times. If EUR/USD has bounced at 1.1000 again and again, that’s a static support or resistance level. These don’t move and can stay relevant for weeks or even months.
2. Dynamic support and resistance levels
These change as the market moves. Moving averages are a good example – they create live levels that act as barriers. If price keeps bouncing off the 50-day moving average, you’re looking at dynamic support in action.
3. Semi-dynamic levels created by tools like Fibonacci retracements
These are somewhere in between. You draw them once based on a previous move, and they stay there until a new high or low forms. Fibonacci retracements often highlight levels where price might correct before continuing its trend.
4. Psychological levels built around round numbers
Humans love round numbers, and so do markets. Levels like 1.2000 or 100.00 attract attention because traders place orders there. These become psychological barriers where price often hesitates.
5. Historical all-time swing highs and lows that carry weight for years
If a pair peaked at 1.6000 years ago, traders still watch that level. These are like landmarks on a chart, and when price approaches them again, the market usually reacts strongly.
How to Find Support and Resistance Levels on Charts
1. Using horizontal aligned tops and bottoms from previous price action
Look at where price has turned multiple times in the past. If you see repeated bounces from the same spot, mark that area. Those horizontal levels are some of the strongest in Forex.
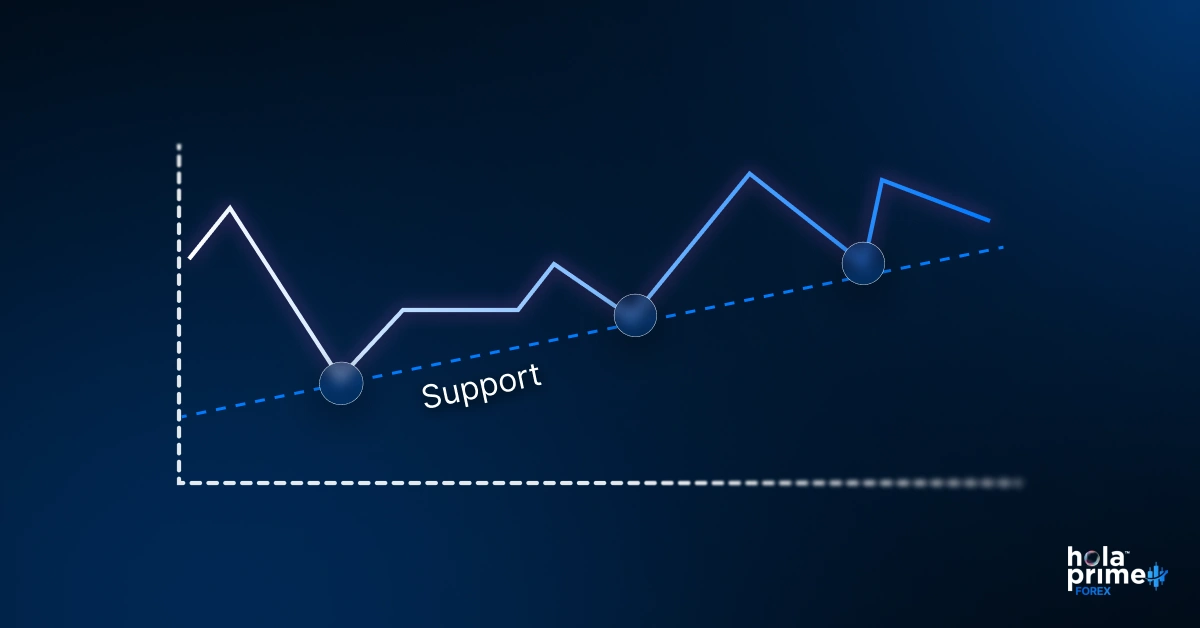
2. Drawing diagonal aligned tops and bottoms to capture trendlines
In trending markets, highs and lows often form diagonally. By connecting them, you create trendlines that show rising support or falling resistance. They’re powerful in spotting continuation patterns.
3. Relying on moving averages as natural barriers in live markets
Moving averages like the 50-day or 200-day are not just trend indicators – they often act as barriers too. Many traders use them as dynamic support or resistance, especially in longer timeframes.
4. Applying Fibonacci retracement levels to measure corrections
When a strong trend pulls back, Fibonacci levels can show you where the correction might stop. Levels like 38.2%, 50%, and 61.8% are commonly watched because price often respects them.
5. Looking at trading volume to confirm strong levels
When you see heavy trading volume around a price point, it usually signals that buyers and sellers care about that level. These high-volume areas often become strong support or resistance zones.
6. Paying attention to round numbers that traders naturally focus on
Levels like 1.0000 or 1.3000 attract attention simply because they’re easy to remember. A lot of orders cluster around these numbers, making them natural support or resistance areas.
7. Trendlines: The Dynamic Duo
Trendlines are like the backbone of chart analysis. By connecting two or more highs or lows, you get a line that helps you see the direction of the market. What makes them powerful is that they’re both dynamic and simple – they show where price has been respecting a diagonal path, almost like a sloping floor or ceiling. Traders often combine trendlines with horizontal support and resistance to get more reliable signals.
How to Trade Support and Resistance Levels
Buy at Support Level
When the price approaches a strong support level, many traders look for a buying opportunity. You don’t just jump in blindly, though – waiting for a confirmation like a bounce or candlestick pattern increases your chances of success.
Sell at Resistance Level
The same idea applies in reverse. When price hits resistance, it’s often a good spot to consider selling or taking profit on a buy trade. Again, confirmation matters. If the level has been tested multiple times, it’s more likely to hold.
Conclusion :
The support and resistance are the terms that you will hear in trading every single day. And these are must to learn to go ahead in trading. Once you master these two levels, you should enter a trade and know when to take profit and leave. There are different advanced strategies you can use to trade support and resistance levels. Now that you have an understanding of these, it’s time to test your skills. Buy your challenge with Hola Prime, and use your skills to earn profits.
FAQs: Support and Resistance Levels
1. What exactly is support in Forex trading?
Support is a price level where the market tends to stop falling and often bounces back up. It’s like a floor that holds the price.
2. How is resistance different from support?
Resistance works as a ceiling – it’s a level where price struggles to move higher and often reverses downward.
3. Can support turn into resistance and vice versa?
Yes, this happens often. Once price breaks through a strong support, it can act as resistance when price goes back up, and the same works the other way around.
4. Should I always buy at support and sell at resistance?
Not blindly. It’s better to wait for confirmation, like a bounce or candlestick signal, before entering a trade.
5. Are support and resistance useful for beginners?
Absolutely. They’re one of the simplest and most practical tools to start with, and you’ll use them even as an advanced trader.
Disclaimer: All information provided on this site is for educational purposes only, related to trading in financial markets. It is not intended as financial advice, business or investment recommendation, or as an opportunity or recommendation to trade any investment instruments. Hola Prime only provides an educational environment to traders, including tools, materials and simulated trading platforms which have data feed provided by Liquidity Providers. The information on this site is not directed at residents in any country or jurisdiction where such distribution or use would be contrary to local laws or regulations.